

Phosphate pollution
Phosphate pollution can cause excessive growth of algae, which can decrease the level of oxygen dissolved in river water. Often our rivers are where economic pressures and environmental constraints most obviously come face to face. Herefordshire is no exception.
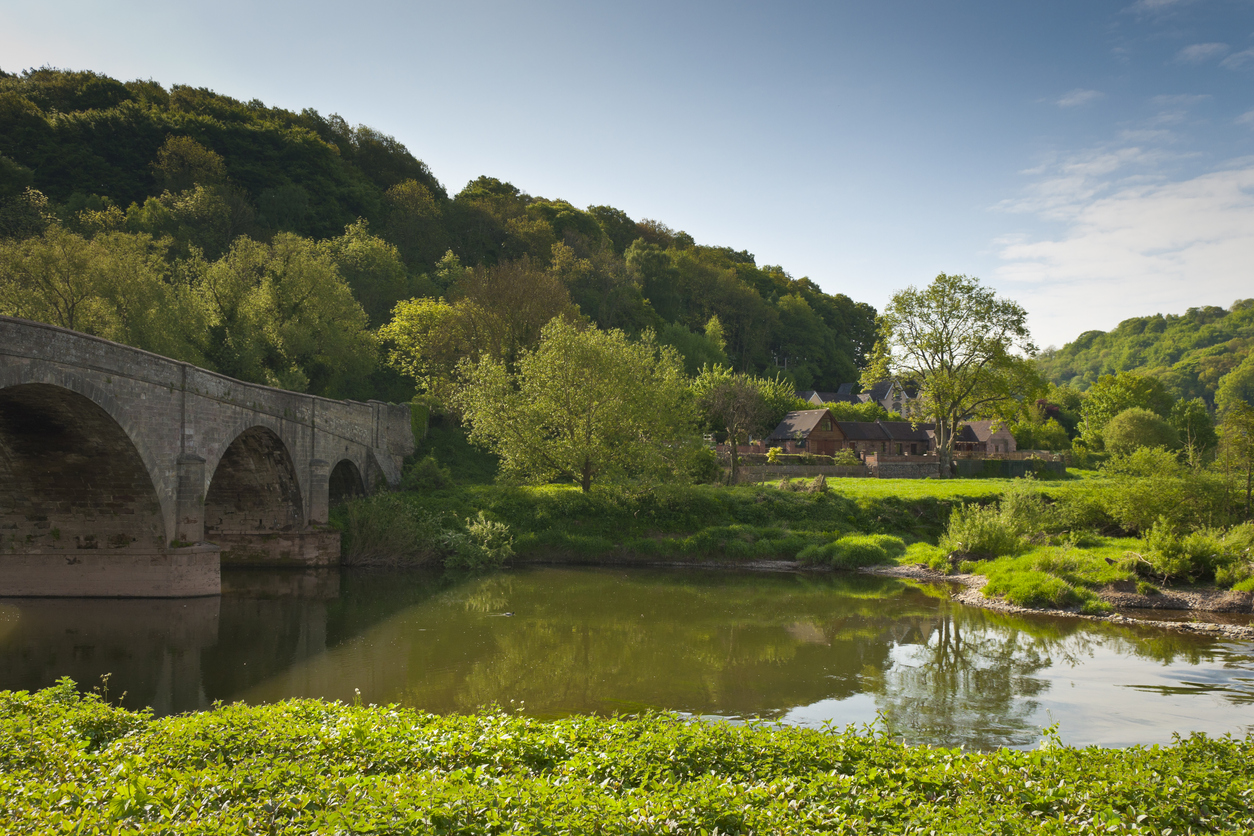
Most of Herefordshire is in the catchment of the River Wye and its waters are a measure of the health of the county’s environment.
Research and data collected by the Environment Agency (EA) shows most of our streams and brooks as well as major rivers such as the Lugg, Arrow and Wye are now failing and have high levels of phosphorous (P). In May 2022 The EA and Natural England revised their target phosphate levels downwards for both the Wye and the Lugg. These lower levels reflect near natural states for the rivers and the revisions show just how serious the situation is.
Heavy loads of phosphate in the water increase the nutrient supply to small organisms. When they boom in numbers, they can starve fish and water plants of oxygen and deprive them of sunlight. In extreme cases, high P levels can lead to blooms of toxic algae harmful to humans and animals
How phosphate accumulates in rivers is complicated and not fully understood by scientists. There seem to be two main sources for the Wye:
- Point sources: Mainly sewage works which accounts for around 25% of pollution.
- Diffuse sources: Run-off from surrounding land next to our streams and rivers. This too can contain a lot of phosphate from animal manure and fertiliser which has been spread on the land. Phosphate can also be found bound up in soil particles. Agricultural practice has a profound effect on these pollution sources. As the industry has moved away from orchards and pasture, run-off has been an increasing problem throughout the county. The proliferation in intensive poultry units throughout the Wye catchment has caused further impact due to the chicken manure that is now stored and spread on the land. Chicken manure is many times more ‘P’-rich than all other types of manure. It is estimated that agriculture may be responsible for up to 75% of the ‘P’ pollution.
RePhoKUs
A collaborative project is underway to understand P pathways in land and waterbodies. RePhoKUs follows a multidisciplinary approach which takes in all aspects of P use, from its usefulness to farmers to the threat it poses to the health of our waterbodies.
Their May 2022 report on the River Wye catchment shows that it’s not just the amount of chicken manure being spread on the land that’s the problem. There are also staggeringly high levels of P already bound up in soils as a result of years of dumping of manure. Each year 3,000 tonnes more phosphate is spread on Herefordshire fields than the plants can take up. Effectively, there is enough phosphate already on the fields to cover the next 5-8 years!
The authors point out that P is an essential but finite resource. It’s now rising in cost due to the war situation in Ukraine so we should be careful not to waste it. Some agricultural land, mostly in the east of Britain, is actually low in P levels and needs the input for good production. However, “leakage of food system P into water is causing widespread damage to the quality and biodiversity of inland and coastal waters in the UK and globally”.
So spreading it in the Wye catchment on land that is already choked with it just makes the situation worse.
Special Area of Conservation
The River Wye itself has a high level of protection under European law as a Special Area of Conservation (SAC). This includes the River Lugg tributary as far up as Hope-under-Dinmore. The Environment Agency (EA) regularly checks phosphate levels in the SAC, and the tributaries that feed into it. In recent years the Wye catchment has, like the Lugg, shown high levels of pollution of grave concern. The algal bloom seen in many parts of the catchment in 2020 started to impact and destroy the ecosystem. In 2021 the River Wye fared no better, and the first bloom appeared as early as March in 2022. Algal bloom is fed by excess (P), low water levels and warmer temperatures. Changing weather patterns are all part of climate change that is adversely affecting our rivers.
Nutrient Management Plan
When the council was finalising its new Local Plan – Core Strategy in 2015, it tackled this problem by creating a Nutrient Management Plan (NMP) to get all phosphate levels within the ceilings by 2027 at the latest.
Now, over seven years on, what progress is the board making towards the critical 2027 target? The short answer until recently was that no one knew.
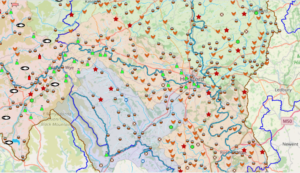
Phosphate mapping commissioned by CPRE Herefordshire
In 2017, out of frustration, we commissioned an expert to extract the raw data from the EA’s website for every current sampling point in the Upper Wye and Lugg catchment inside Herefordshire and turned the data into a set of easily read graphs and a map. You can look at the map (red points are over the ceiling, green are under). Click on each point to bring up the graph for that point): Map of phosphate data.
By clicking on any of the points you can bring up a time graph of sampling results for that point. Individual samples can vary from month to month, so to help establish whether there is any definable trend over time, the graph includes a 12-month moving average as a red line. So far, there seems to be no clear trend of improvement across the catchment since 2015 – despite the work done by the Wye and Usk Foundation and other local environmental groups in helping farmers reduce phosphate run-off from their land.
Citizen Science
In 2021 we took the initiative to make available more monitoring points and more data for the EA.
In conjunction with the University of Cardiff, the Wye and Usk Foundation, the EA and other bodies such as Friends of the Upper Wye and Friends of the Lugg, we have recruited volunteers who want to make a difference and help monitor ‘P’ levels across the county. This data is being used by scientists at Cardiff University and the EA to establish exactly where polluted run-off is coming from. The regulatory agencies should then act against any landowners that do not take all needed actions to stop pollution. The EA is working on making all the data open-source.
All involved will be part of the solution in cleaning up our majestic waterways and restoring them to healthy ecosystems where fish and plants can flourish.
Mapping the potential sources
We’ve also teamed up with the Brecon and Radnor branch of Campaign for the Protection of Rural Wales (CPRW) to produce an interactive layered map showing monitoring sites, pollution incidents and intensive poultry and pig units. (There’s a lot of data so it may take a few moments to upload!).